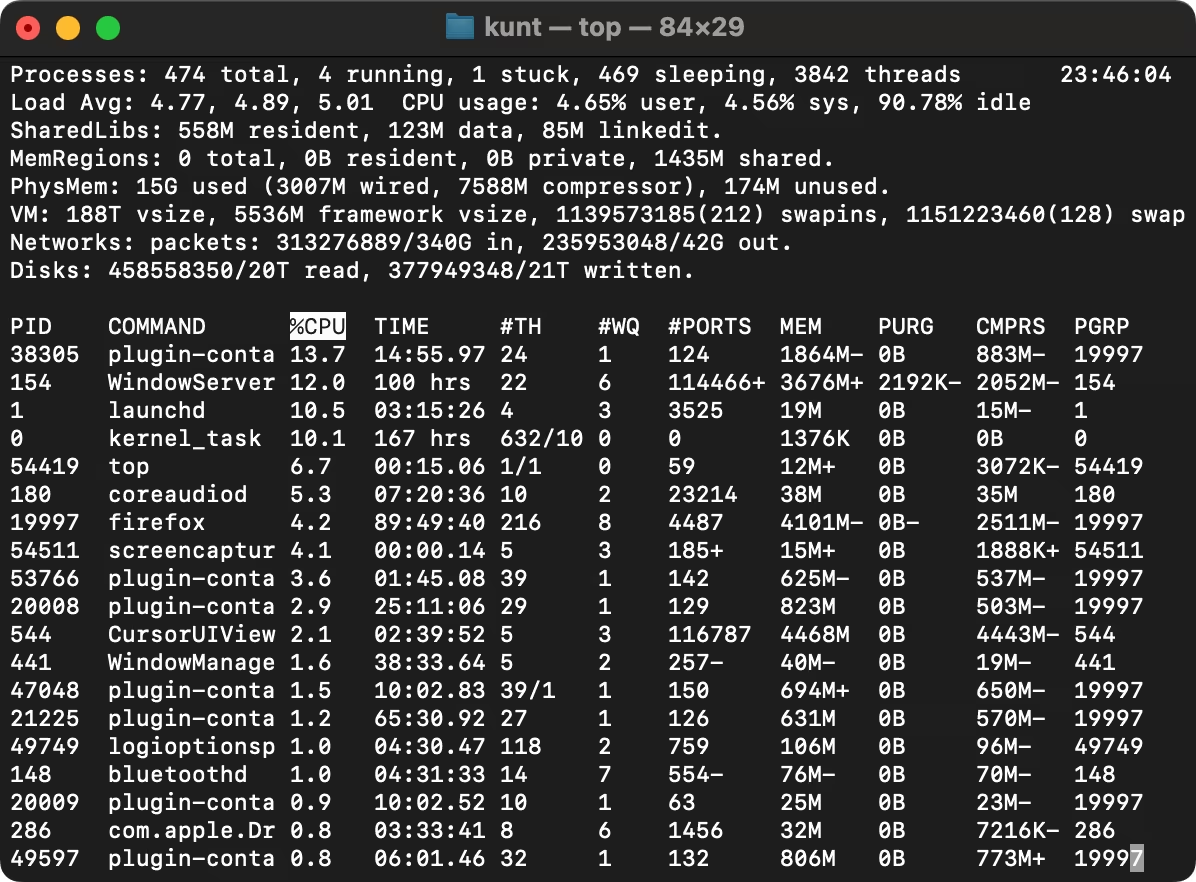
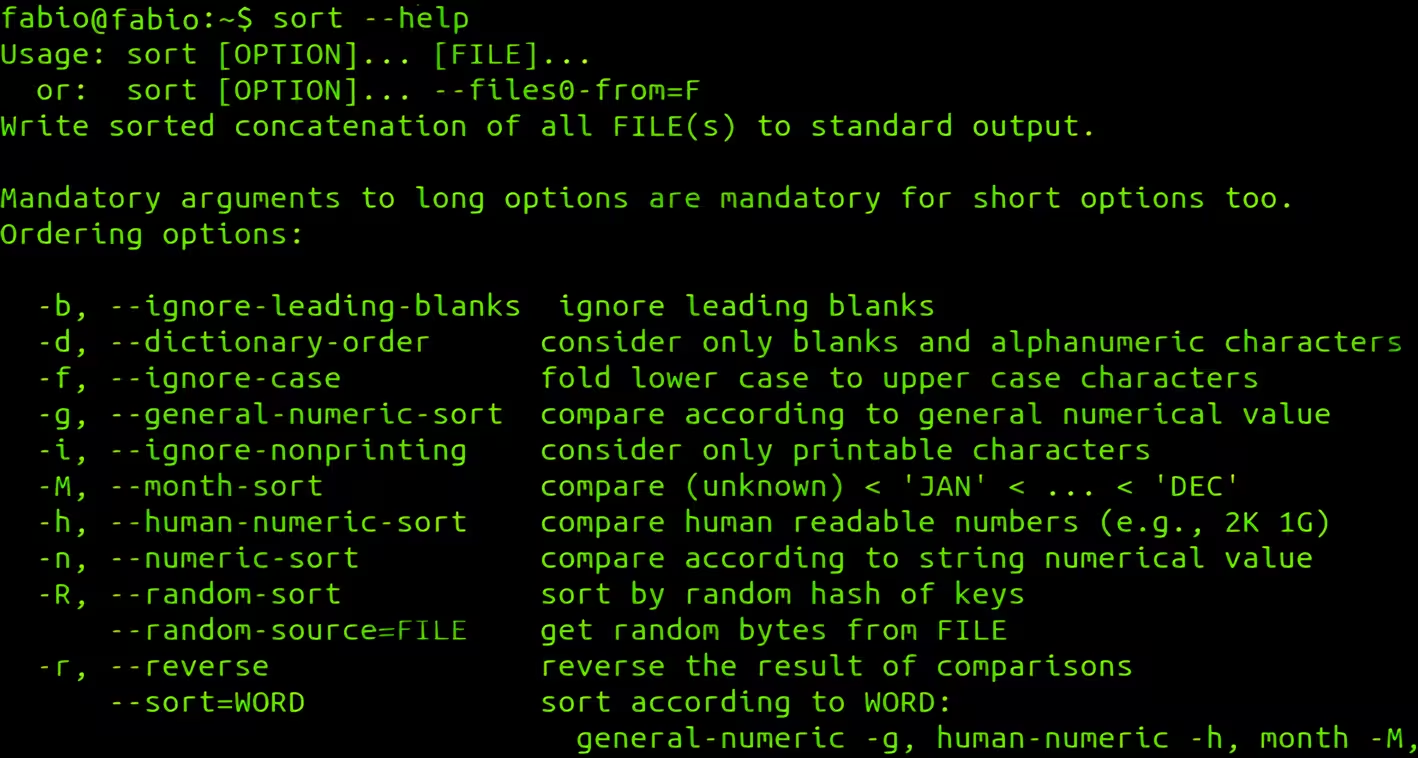
These examples demonstrate how to use top both interactively and non-interactively, enabling you to monitor system performance, filter by user, focus on specific processes, and customize the display for your needs.
Contents
Basic top Usage
- Start
top
Open the default system monitor:
top- Update Interval
Refresh the display everyNseconds (e.g., 2 seconds):
top -d 2Process Sorting
- Sort by CPU Usage
PressP(Shift + p) whiletopis running. - Sort by Memory Usage
PressM(Shift + m). - Sort by Process ID (PID)
PressN.
Filtering Processes
- Show Processes for a Specific User
Pressu, then enter the username.
Example:
top -u apache- Monitor a Single Process
Track a process by PID:
top -p 1234- Highlight Running Processes
PressRto toggle highlighting.
Batch Mode (Scripting)
- Run
topOnce and Exit
top -n 1 -b- Save Output to a File
bash top -n 3 -b > top_log.txt
Customizing the Display
- Toggle Full Command Path
Presscto show the full command line. - Add/Remove Columns
Pressfto select fields (e.g., PPID, priority). - Toggle Colors
Pressz. - Hide Idle Processes
Pressito show only active tasks.
Process Management
- Kill a Process
Pressk, then enter the PID and signal (default:15for SIGTERM).
Example:PID to kill: 1234 Signal: 9 # SIGKILL - Renice a Process
Pressr, then enter the PID and new priority (e.g.,-15to19).
Advanced Examples
- Monitor Threads
Show threads instead of processes:top -H - Show Cumulative CPU Time
PressSto toggle cumulative mode. - Check Load Average
Look at theload averagein the header (1/5/15-minute averages). - Tree View
PressVto show parent-child process hierarchy.
Key Interactive Commands
| Shortcut | Action |
|---|---|
h | Help menu |
q | Quit |
W | Save current layout to ~/.toprc |
l | Toggle load average display |
t | Toggle task/cpu stats |
1 | Show individual CPU cores |
Common Use Cases
- Identify CPU Hogs: Sort by CPU (
P) and check%CPUcolumn. - Find Memory Leaks: Sort by memory (
M) and monitor%MEM. - Kill Zombie Processes: Look for
Zin theSTATcolumn. - Check I/O Wait: Look at
%wain the CPU summary line.
Pro Tips
- Use
shift + >or<to change the sort field dynamically. - Combine with
grepfor quick filtering:
top -b -n 1 | grep "nginx"- For a modern alternative, try
htop(sudo apt install htop).


